# 如何获取服务器JVM运行堆栈
当系统出现下列情况之一时,可能需要系统管理员能获取到服务器的java虚拟机的运行堆栈,来帮助研发人员排查问题:
- 访问系统某些功能时反应很慢,但其他功能正常。
- 访问系统所有页面都很慢,但网络是正常的。
- 怀疑系统内部有死锁。
- 为了更准确的定位问题,可以多获取几次堆栈信息,每次获取间隔1~3秒时间。
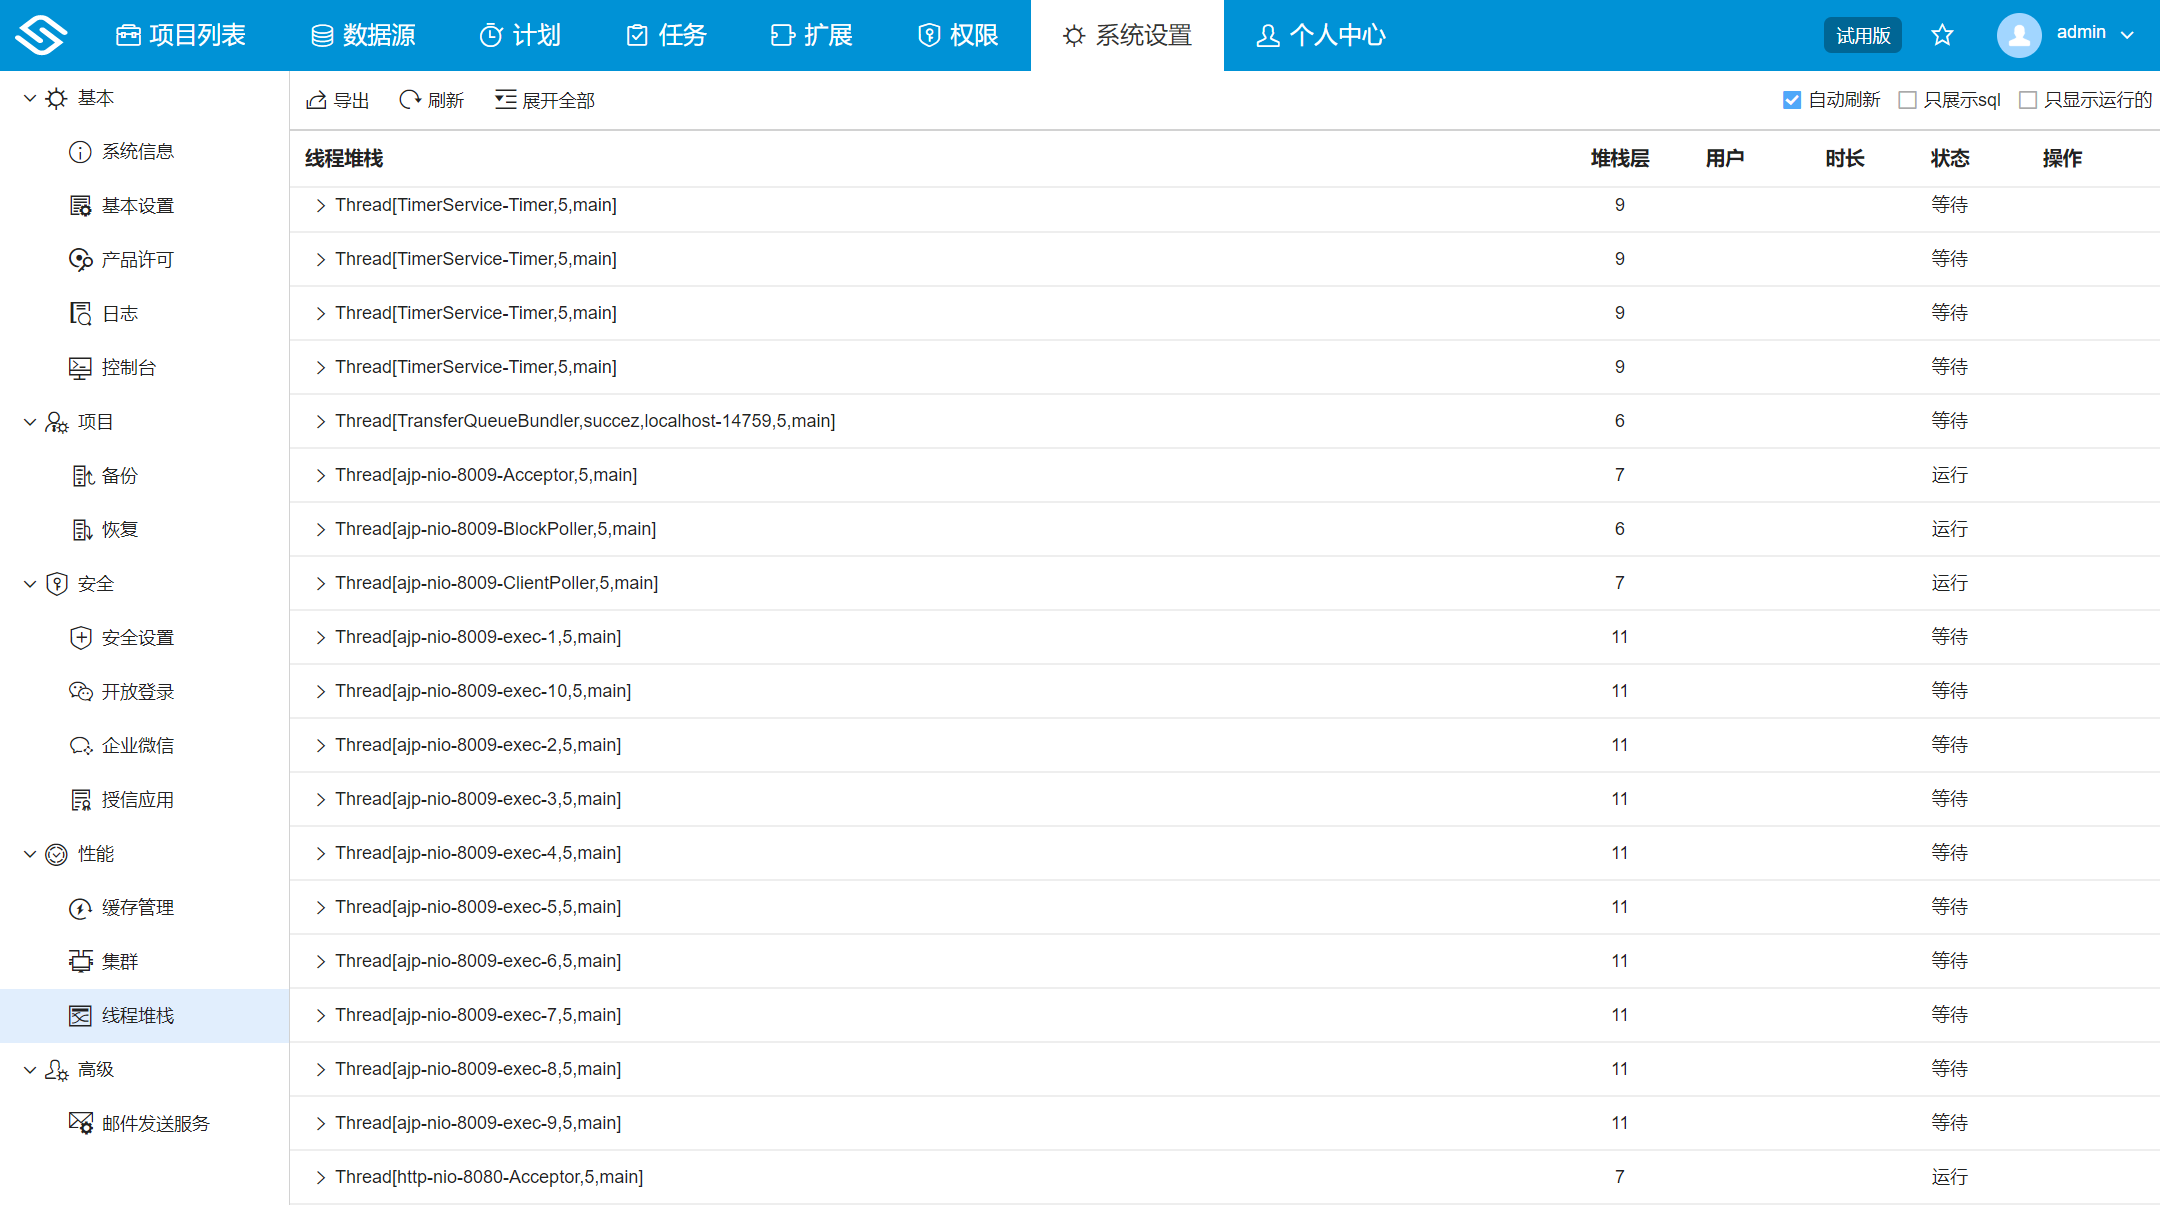
# 方法1.通过系统功能“线程堆栈”
访问系统设置下的线程堆栈,效果如下图所示(当系统出现故障、卡顿、网络不畅时可能无法进入系统设置,此时需要使用下面的其他方法):
# 方法2.windows上ctrl+break
在windows的cmd控制台上启动tomcat、jetty时,可以通过按下简单ctrl+break来获取JVM堆栈,堆栈会直接输出到标准输出上
# 方法3.linux、unix上kill -3命令
使用kill -3 + java进程号,可以通知java进程输出其线程堆栈,sun的jdk会直接将堆栈输出到标准输出上,ibm的jdk(websphere)会生成javacore文件。
linux/unix+websphere获取java线程堆栈信息的具体操作步骤如下:
通过命令
ps -ef | grep java来获取相应的java进程号,例如下面的命令可以显示websphere的server1进程的进程号是8913104was@ZHSIMAVAR1:/home/was#ps -ef | grep java | grep server1 was 8913104 1 2 May 26 - 9:46 /home/was/IBM/WebSphere/AppServer/java/bin/java -Declipse.security -Dwas.status.socket=32891 -Dosgi.install.area=/home/was/IBM/WebSphere/AppServer -Dosgi.configuration.area=/home/was/IBM/WebSphere/AppServer/profiles/AppSrv01/servers/server1/configuration -Djava.awt.headless=true -Dosgi.framework.extensions=com.ibm.cds,com.ibm.ws.eclipse.adaptors -Xshareclasses:name=webspherev80_%g,groupAccess,nonFatal -Xbootclasspath/p:/home/was/IBM/WebSphere/AppServer/java/jre/lib/ibmorb.jar -classpath /home/was/IBM/WebSphere/AppServer/profiles/AppSrv01/properties:/home/was/IBM/WebSphere/AppServer/properties:/home/was/IBM/WebSphere/AppServer/lib/startup.jar:/home/was/IBM/WebSphere/AppServer/lib/bootstrap.jar:/home/was/IBM/WebSphere/AppServer/lib/jsf-nls.jar:/home/was/IBM/WebSphere/AppServer/lib/lmproxy.jar:/home/was/IBM/WebSphere/AppServer/lib/urlprotocols.jar:/home/was/IBM/WebSphere/AppServer/deploytool/itp/batchboot.jar:/home/was/IBM/WebSphere/AppServer/deploytool/itp/batch2.jar:/home/was/IBM/WebSphere/AppServer/java/lib/tools.jar -Dibm.websphere.internalClassAccessMode=allow -Xms1024m -Xmx4096m -Xcompressedrefs -Xscmaxaot4M -Xscmx60M -Dws.ext.dirs=/home/was/IBM/WebSphere/AppServer/java/lib:/home/was/IBM/WebSphere/AppServer/profiles/AppSrv01/classes:/home/was/IBM/WebSphere/AppServer/classes:/home/was/IBM/WebSphere/AppServer/lib:/home/was/IBM/WebSphere/AppServer/installedChannels:/home/was/IBM/WebSphere/AppServer/lib/ext:/home/was/IBM/WebSphere/AppServer/web/help:/home/was/IBM/WebSphere/AppServer/deploytool/itp/plugins/com.ibm.etools.ejbdeploy/runtime -Dderby.system.home=/home/was/IBM/WebSphere/AppServer/derby -Dcom.ibm.itp.location=/home/was/IBM/WebSphere/AppServer/bin -Djava.util.logging.configureByServer=true -Duser.install.root=/home/was/IBM/WebSphere/AppServer/profiles/AppSrv01 -Djava.ext.dirs=/home/was/IBM/WebSphere/AppServer/tivoli/tam:/home/was/IBM/WebSphere/AppServer/java/jre/lib/ext -Djavax.management.builder.initial=com.ibm.ws.management.PlatformMBeanServerBuilder -Dpython.cachedir=/home/was/IBM/WebSphere/AppServer/profiles/AppSrv01/temp/cachedir -Dwas.install.root=/home/was/IBM/WebSphere/AppServer -Djava.util.logging.manager=com.ibm.ws.bootstrap.WsLogManager -Dserver.root=/home/was/IBM/WebSphere/AppServer/profiles/AppSrv01 -Dcom.ibm.security.jgss.debug=off -Dcom.ibm.security.krb5.Krb5Debug=off -Dfile.encoding=UTF-8 -Djava.library.path=/home/was/IBM/WebSphere/AppServer/lib/native/aix/ppc_64/:/ima/vg1/IBM/WebSphere/AppServer/java/jre/lib/ppc64/default:/ima/vg1/IBM/WebSphere/AppServer/java/jre/lib/ppc64:/ima/vg1/IBM/WebSphere/AppServer/java/jre/lib/ppc64/j9vm:/ima/vg1/IBM/WebSphere/AppServer/java/jre/../lib/ppc64:/home/was/IBM/WebSphere/AppServer/bin:/usr/lib:/ima/vg1/IBM/cognos/c10/bin64/: -Djava.endorsed.dirs=/home/was/IBM/WebSphere/AppServer/endorsed_apis:/home/was/IBM/WebSphere/AppServer/java/jre/lib/endorsed:/home/was/IBM/WebSphere/AppServer/endorsed_apis:/home/was/IBM/WebSphere/AppServer/java/jre/lib/endorsed -Djava.security.auth.login.config=/home/was/IBM/WebSphere/AppServer/profiles/AppSrv01/properties/wsjaas.conf -Djava.security.policy=/home/was/IBM/WebSphere/AppServer/profiles/AppSrv01/properties/server.policy com.ibm.wsspi.bootstrap.WSPreLauncher -nosplash -application com.ibm.ws.bootstrap.WSLauncher com.ibm.ws.runtime.WsServer /home/was/IBM/WebSphere/AppServer/profiles/AppSrv01/config ZHSIMAVAR1Node01Cell ZHSIMAVAR1Node01 server1执行kill -3 + java进程号,如:
kill -3 8913104javacore文件会自动生成在在websphere的profile目录下,例如
javacore.20130527.173545.8913104.0001.txt,文件名中有时间信息:was@ZHSIMAVAR1:/home/was#cd /home/was/IBM/WebSphere/AppServer/profiles/AppSrv01 was@ZHSIMAVAR1:/home/was/IBM/WebSphere/AppServer/profiles/AppSrv01#ls -l total 46864 drwxr-xr-x 2 was was 4096 May 27 17:12 WORKDIR_IS_UNDEFINED drwxr-xr-x 3 was was 12288 Apr 10 17:38 bin drwxr-xr-x 9 was was 256 Apr 10 17:51 config drwxr-xr-x 6 was was 256 Apr 10 17:44 configuration drwxr-xr-x 10 was was 256 May 16 21:35 consolepreferences drwxr-xr-x 3 was was 4096 Apr 10 17:38 etc drwxr-xr-x 2 was was 4096 Apr 10 17:37 firststeps drwxr-xr-x 2 was was 256 Apr 10 17:37 installableApps drwxr-xr-x 3 was was 256 Apr 10 17:38 installedApps drwxr-xr-x 2 was was 256 Apr 10 17:37 installedConnectors drwxr-xr-x 3 was was 256 Apr 10 17:51 installedFilters -rw-r--r-- 1 was was 6490778 Apr 19 14:24 javacore.20130419.142441.8585306.0001.txt -rw-r--r-- 1 was was 6507262 Apr 19 14:24 javacore.20130419.142446.8585306.0002.txt -rw-r--r-- 1 was was 6488667 Apr 19 14:24 javacore.20130419.142448.8585306.0003.txt -rw-r--r-- 1 was was 4456135 May 27 17:35 javacore.20130527.173545.8913104.0001.txt drwxr-xr-x 5 was was 256 Apr 10 17:59 logs drwxr-xr-x 4 was was 4096 Apr 10 17:38 properties drwxr-xr-x 3 was was 256 Apr 10 17:38 servers drwxr-xr-x 5 was was 4096 Apr 10 17:51 temp drwxr-xr-x 3 was was 256 Apr 10 17:51 tranlog drwxr-xr-x 8 was was 4096 May 26 10:01 workspace drwxr-xr-x 12 was was 4096 May 26 10:01 wstemp
linux/unix+tomcat/weblogic 获取java线程堆栈信息的具体操作步骤如下:
- 获取进程id和kill命令和上面的操作一致。
- tomcat的输出信息在catalina.out文件中。
- weblogic在weblogic的标准输出文件中,如果是使用nohup启动的weblogic那么可能在nohup.out文件中。
# 方法4. jstack -l pid 命令
jstack -l 12353 > ./jvm-stacktrace.log
jstack 为java自带的命令,可以在java安装目录bin下找到,12353 为当前java对应的进程号。 导出线程堆栈,建议间隔几秒钟连续导出3次,要捕捉到当时计算的场景。
# 线程内容分析
通过ibm提供的javacore分析工具jca441.jar打开javacore文件,参考ibm官方说明 (opens new window),点击 此处下载jca441.jar。
使用命令
java -jar ~/Downloads/jca441.jar运行,然后点击工具栏上面的Open Thread Dumps按钮,选择javacore文件即可。